Already a subscriber? Activate your premium account
Already a subscriber? Activate your premium account
Potatoworld Magazine

This autumn a mechanization fair “Agrotechniek Holland” ATH was held near Biddinghuizen in the Netherlands. Demonstrations and displays showed the newest available technique in Agriculture. One of the demonstrations involved a smart farming pavilion with a potato field used for demonstration of smart farming techniques. In the field different fertilizer applications and plant distances were applied, with the objective to create visible differences.
Various companies that sold equipment were involved, promoting sensing techniques and images made with drone’s, airplanes and satellites. Suppliers of weather stations and soil sensors also had the opportunity to install their equipment on the test field. An advisory organization sampled the crop for stem weight, tuber weight, number of stems and number of tubers. Finally the crop was harvested during the fair with a harvester equipped with a yield logger to create yield maps. We were involved in analyzing the data collected in the field and creating a large display used in the pavilion.
I spent several days at the fair explaining this display and the demonstration field to the visitors (mostly farmers) and tell them what was done on the demonstration field. I made clear what could be seen on the different pictures taken with drones and airplanes, which measurements were taken at the different weather stations and how soil moisture was measured. The question I got most often from farmers was “What’s in it for me?”. The value of some of the measurements was clear to them. With weather and soil moisture data they can directly translate that to better crop management. However for images taken with different sensors the added value was less obvious. What is the value of sensor images from the air; can we see more than we see with our naked eye and what can we do with it?
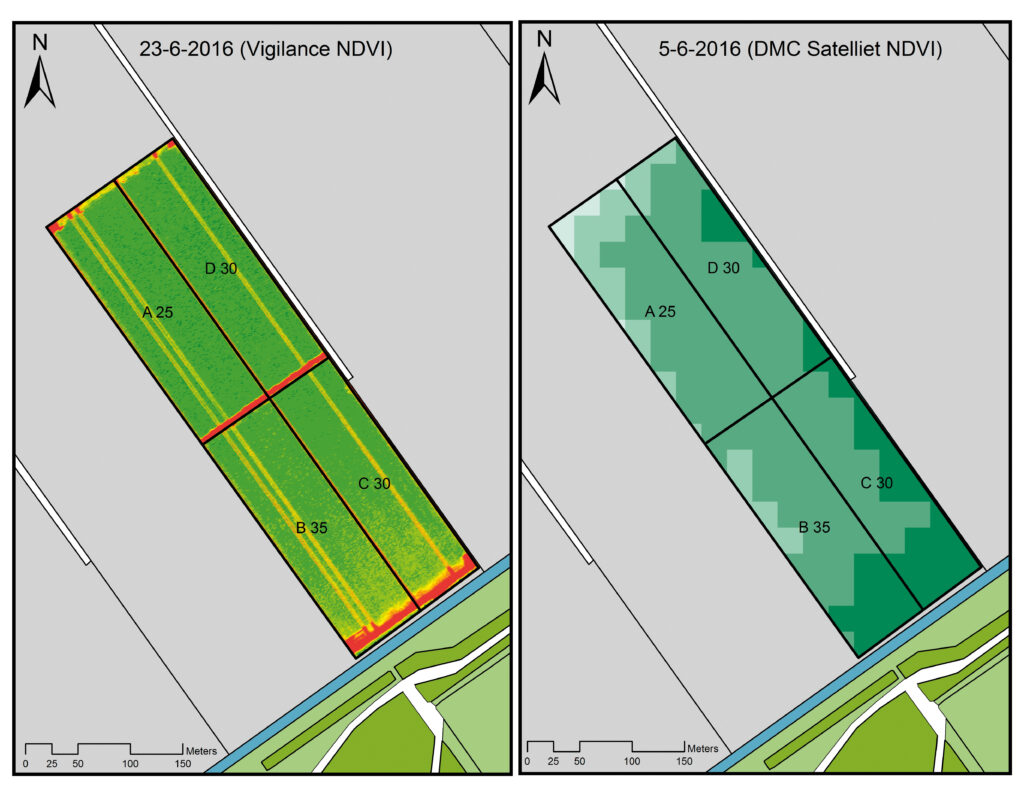
In the demonstration field we could see differences in vegetation with NDVI (normalized difference vegetation index), a measurement of de above ground biomass at the end of June. The same difference could be seen with the naked eye or normal photography 4 weeks later. We could take tests from the leaves and test soil samples to find out that the differences were caused by a mistake in fertilizer application and take action in time to prevent yield loss. For demonstration purposes we did not repair the mistake, but unlike what was found for other crops we did not find a relation between NDVI images and the yield map. Potato seems to follow other rules and we still have to find them.
Back to the question of farmers “What’s in it for me?”. I cannot give a definite answer based on the potato demonstration field. Drones, airplanes and satellites only show above ground biomass. Differences early in the season may be important for the final yield. If you can see differences early in the season they may help you to manage and improve your crop. But then again images show only difference in biomass or crop activity. A farmer still has to go into the field to determine the cause of these differences and these differences don’t have to lead to variation in tuber yield later on. At this moment my answer to farmers is: It’s an extra eye in the sky early in the season but you still need your farmer skills.
Dr. Ir. Peter Kooman
Professor Potato supply chain and sector innovation
CAH Vilentum University of Applied Sciences
p.kooman@cahvilentum.nl


Events


©2015 - 2024 Potatoworld | Webdesign and realisation COMMPRO